"The No. 1 reason for catastrophic facility failure is lack of electrical maintenance,” Brill writes. “Electrical connections need to be checked annually for hot spots and then physically tightened at least every three years. Many sites cannot do this because IT’s need for uptime and the facility department’s need for maintenance downtime are incompatible. Often IT wins, at least in the short term. In the long term, the underlying science of materials always wins.”
Showing posts with label redundancy. Show all posts
Showing posts with label redundancy. Show all posts
Maintenance, Downtime and Outages
Via Data Center Knowledge - Maintenance, Downtime and Outages a quote from Ken Brill of The Uptime Institute:
Estimating the Availability of Simple Systems - Introduction
I've spent a bit of time thinking about how to estimate the expected availability of simple systems. I'm interested not in detailed calculations of complex systems, but rather in rule of thumb type of estimates for simple systems. I suspect that this problem can be as hard or as easy as one would like to make it. I'm going to try to make it easy. Wish me luck.
This post introduces the estimations. Part One covers non-redundant systems. Part Two covers simple redundant systems.
Assumptions:
I'll start out with the following assumptions:
(1) That you have a basic understanding of MTBF and MTTR.
(2) That your SLA allows for maintenance windows. Maintenance windows, if you are fortunate enough to still have them, allow 'free' outages, provided that the outage can be moved to the maintenance window.
(3) That you have the principles laid out in my availability post implemented, including:
(8) That service contracts exist, they match the SLA's, and are routinely met by the vendors. In other words if you have a two hour part replacement contract, the vendor has to have depot spares less than one hour away and deliver them in less than two hours. Not all vendors do that. And if your SLA is 24 x 7 x 365, your support and maintenance contracts are also 24 x 7 x 365.
The estimates will:
WAN links - T1's, DS3's, etc. For all non-redundant WAN links I figure an average of 4 hours per year WAN related network outage. Over hundreds of circuit-years of experience, figuring in backhoes, storms, tornadoes, circuit errors, etc, I figure that one outage every other year with an 8 hour MTTR is a reasonable estimate. Actual data from a couple hundred circuit-years of data is better that the estimate (one outage every 4 years with a 5 hour time to repair).
Routers, switches, firewalls and similar devices, booted from flash, no moving parts other than power supply fans I figure at one failure every 5 years, with the MTTR dependent on service contracts and sparing. If you have spare on hand, or you have good vendor service, your MTTR can be figured at 2 or 4 hours. If not, figure at lest 8 hours. If our network-like devices have disk drives or are based on PC components, I figure their failure rate to be the same as servers (see below).
SAN fabric, properly implemented, I figure at one failure every 5 years as with network devices, but because most SAN fabrics are built redundant, the MTTR is essentially zero, so SAN fabric errors rarely affect availability. The emphasis though, is on 'properly implemented'.
SAN LUN's, properly implemented, I figure at one failure every 10 years. But SAN LUN or controller failure, even though it is rare, likely has a very long MTTR. Recovering from failed LUN's is non-trivial, so at least 8 hours MTTR must be figured, with the potential for more, up to 24 hours.
Servers, with structured system management applied and with redundant disks, I figure at about one 8 hour outage every two years, or about 4 hours per server per year. Servers that are ad hoc managed, or servers without lights out management or redundant power supplies, I figure at about one 8 hour outage per year.
Power and cooling is highly variable. We have one data center where power/cooling issues historically have caused about 8 hours outage per year. We can't remember the last time we have a power issue in our other data center. I figure power/cooling issues on a per site basis, with estimates of 2 hours per year on the low end, and 8 hours per year on the high end.
Stacking the estimates.
Once you have a rough estimate of the availability of the various components in an application stack, you can apply them to your application.
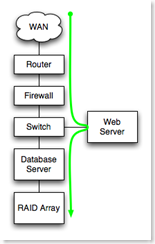 Serial Dependencies increase recovery time. In a chain of components in series, any failed component in the chain causes failure of the entire chain. In this case, the number of failures of the system is the sum of the number of failures of each series component. The recovery time for each component is also added in series.
In the example to the right, all components from WAN at the top to RAID array at the bottom are serially dependent. Each must function for the application to function, and failure of a component is a failure of the application.
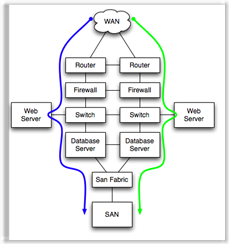 Parallel Dependencies improve recovery time. Components in parallel, properly configured for some form of automatic load balancing or failover, have an MTTR equal to the failover time for the pair of parallel components. Examples would be Microsoft Clustering Services, high availability firewall pairs, load balanced application servers, etc. In each of those cases, the high availability technology has a certain time window for detecting and disabling the failed component and starting the service on the non-failed parallel component. Parallel component failover and recovery times typically range from a few seconds to a few minutes.
In the example to the left, if either the green or the blue path is available, the application will function.
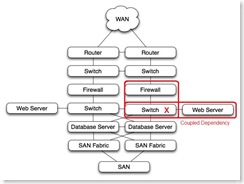 Coupled dependencies, as in the firewall-> switch -> web server stack shown, force the failure of dependent components when a single component fails. In this case, if the switch were to fail, the web sever would also fail, and the firewall, if active, would also see a failed interface and force a failover to the other firewall.
Coupled dependencies tend to be complex. Identification and testing of coupled dependencies ensures that the various failure modes of coupled components are well understood and predictable. Technologies like teamed nic's and etherchannel can be used to de-couple dependencies.
On to Part One - Non Redundant Systems
This post introduces the estimations. Part One covers non-redundant systems. Part Two covers simple redundant systems.
Assumptions:
I'll start out with the following assumptions:
(1) That you have a basic understanding of MTBF and MTTR.
(2) That your SLA allows for maintenance windows. Maintenance windows, if you are fortunate enough to still have them, allow 'free' outages, provided that the outage can be moved to the maintenance window.
(3) That you have the principles laid out in my availability post implemented, including:
- Tier 1 hardware with platform management software installed, configured and tested. (Increases MTBF, Decreases MTTR)
- Stable power, UPS and generator. (Increases MTBF)
- Staff are available during SLA hours, either officially working or available via some form of on-call. (Decreases MTTR)
- Structured System Management implemented. (Increases MTBF, Decreases MTTR)
- Service contracts that match application SLA's. (Decreases MTTR)
- You have well designed, reliable power and cooling. (Increases MTBF)
- You have remote management, lights out boards and remote consoles on all devices.
(5) That you understand where you have coupled dependencies. Examples:
- In a typical redundant router -> switch -> firewall stack, a failure of the switch will cause interfaces on the router and firewall to fail. Those interface failures will trigger an HA failover on both the HA router pair and the HA firewall pair.
- In a typical dual powered rack, devices with single power supplies configured in HA pairs and are connected such that power failure of one side of the racks leaves the correct half of the HA pair still running.
(6) That you have Tier 1 hardware from a major manufacturer with platform management software installed, configured and tested. You need the predictive failure messages that modern servers are capable of generating showing up on your SMS device. Predictive failure doesn't change the rate at which components fail, but it allows you you proactively schedule replacement of failed components during maintenance windows. This gives you 'freebie' failed component replacement. If you do not have Tier 1 hardware and do not have platform management software configured, your failure rate and your recovery time will will both increase.
(7) That staff are available during SLA hours, either officially working or available via some kind of on-call.
The estimates will:
- Be conservative estimates, with plenty of room for error.
- Include operating system issues.
Include hardware issues
The major components I'll cover are:
- Wan Links
- Routers, switches, firewalls and similar devices
- SAN fabrics
- SAN LUNs
- Servers
- Power and Cooling
Excluded from the estimates are:
- Databases, database issues, database performance problems.
- Web Applications, including performance problems, configuration problems.
Once-in-a lifetime events (like an Interstate bridge falling down 100 meters from your data center). - The human factor.
A handy chart
A chart of failure and MTTR assumptions might be handy. I'll express failure and recovery in hours per year. The math is pretty simple. Number of failure per year * hours to recover = hours failed per year. It can be converted to 'nines' later.
| Component | Failures per Year | Hours to Recover | Hours Failed per year |
| WAN Link | .5 | 8 | 4 |
| Routers, Devices | .2 | 4 | .8 |
| SAN Fabric | .2 | 4 | .8 |
| SAN LUN | .1 | 12 | .12 |
| Server | .5 | 8 | 4 |
| Power/Cooling | 1 | 2 | 2 |
WAN links - T1's, DS3's, etc. For all non-redundant WAN links I figure an average of 4 hours per year WAN related network outage. Over hundreds of circuit-years of experience, figuring in backhoes, storms, tornadoes, circuit errors, etc, I figure that one outage every other year with an 8 hour MTTR is a reasonable estimate. Actual data from a couple hundred circuit-years of data is better that the estimate (one outage every 4 years with a 5 hour time to repair).
Routers, switches, firewalls and similar devices, booted from flash, no moving parts other than power supply fans I figure at one failure every 5 years, with the MTTR dependent on service contracts and sparing. If you have spare on hand, or you have good vendor service, your MTTR can be figured at 2 or 4 hours. If not, figure at lest 8 hours. If our network-like devices have disk drives or are based on PC components, I figure their failure rate to be the same as servers (see below).
SAN fabric, properly implemented, I figure at one failure every 5 years as with network devices, but because most SAN fabrics are built redundant, the MTTR is essentially zero, so SAN fabric errors rarely affect availability. The emphasis though, is on 'properly implemented'.
SAN LUN's, properly implemented, I figure at one failure every 10 years. But SAN LUN or controller failure, even though it is rare, likely has a very long MTTR. Recovering from failed LUN's is non-trivial, so at least 8 hours MTTR must be figured, with the potential for more, up to 24 hours.
Servers, with structured system management applied and with redundant disks, I figure at about one 8 hour outage every two years, or about 4 hours per server per year. Servers that are ad hoc managed, or servers without lights out management or redundant power supplies, I figure at about one 8 hour outage per year.
Power and cooling is highly variable. We have one data center where power/cooling issues historically have caused about 8 hours outage per year. We can't remember the last time we have a power issue in our other data center. I figure power/cooling issues on a per site basis, with estimates of 2 hours per year on the low end, and 8 hours per year on the high end.
Your assumptions for failure frequency and recovery time might be different than mine.
Once you have a rough estimate of the availability of the various components in an application stack, you can apply them to your application.
First steps:
- Sketch out your application stack
- Identify each component
- Identify parallel verses serial dependencies
- Identify coupled dependencies
 Serial Dependencies increase recovery time. In a chain of components in series, any failed component in the chain causes failure of the entire chain. In this case, the number of failures of the system is the sum of the number of failures of each series component. The recovery time for each component is also added in series.
In the example to the right, all components from WAN at the top to RAID array at the bottom are serially dependent. Each must function for the application to function, and failure of a component is a failure of the application.
 Parallel Dependencies improve recovery time. Components in parallel, properly configured for some form of automatic load balancing or failover, have an MTTR equal to the failover time for the pair of parallel components. Examples would be Microsoft Clustering Services, high availability firewall pairs, load balanced application servers, etc. In each of those cases, the high availability technology has a certain time window for detecting and disabling the failed component and starting the service on the non-failed parallel component. Parallel component failover and recovery times typically range from a few seconds to a few minutes.
In the example to the left, if either the green or the blue path is available, the application will function.
 Coupled dependencies, as in the firewall-> switch -> web server stack shown, force the failure of dependent components when a single component fails. In this case, if the switch were to fail, the web sever would also fail, and the firewall, if active, would also see a failed interface and force a failover to the other firewall.
Coupled dependencies tend to be complex. Identification and testing of coupled dependencies ensures that the various failure modes of coupled components are well understood and predictable. Technologies like teamed nic's and etherchannel can be used to de-couple dependencies.
On to Part One - Non Redundant Systems
Estimating the Availability of Simple Systems - Non-redundant
In the Introductory post to this series, I outlined the basics for estimating the availability of simple systems. This post picks up where the first post left off and attempts to look at availability estimates for non-redundant systems.
Let's go back to the failure estimate chart from the introductory post
| Component | Failures per Year | Hours to Recover | Hours Failed per year |
| WAN Link | .5 | 8 | 4 |
| Routers, Devices | .2 | 4 | .8 |
| SAN Fabric | .2 | 4 | .8 |
| SAN LUN | .1 | 12 | .12 |
| Server | .5 | 8 | 4 |
| Power/Cooling | 1 | 2 | 2 |
And apply it to a simple stack of three non-redundant devices in series.  Assuming that the devices are all 'boot from flash and no hard drive' we would apply the estimated failures per year and hours to recover in series for each device from the Routers/Devices row of the table. For series dependencies, where the availability of the stack depends on each of the devices in the stack, simply adding the estimated failures and recovery times together gives us an estimate for the entire stack.
For each device:
.2 failures/year * 4 hours to recover = .8 hours/year unavailability.
For three devices in series, each with approximately the same failure rate and recovery time, the unavailability estimate would be the sum of the unavailability of each component, or .8 + .8 + .8 = 2.4 hours/year.
Notice a critical consideration. The more non-redundant devices you stack up in series, the lower your availability. (Notice I made that sentence in bold and italics. I did that 'cause it's a really important concept.)
The non-redundant series dependencies also apply to other interesting places in a technology stack. For example, if I want my really big server to go faster, I add more memory modules so that the memory bus can stripe the memory access across more modules and spend less time waiting for memory access. Those memory modules are effectively serial, non-redundant. So for a fast server, we'd rather have 16 x 1GB DIMMs than 8 x 2GB DIMMs or 4 x 4GB DIMMs. The server with 16 x 1GB DIMMs will likely go faster than the server with 4 x 4DB DIMMs, but it will be 4 times as likely to have memory failure.
Let's look at a more interesting application stack, again a series of non-redundant components.
We'll assume that this is a T1 from a provider, a router, firewall, switch, application/web server, a database server and attached RAID array. The green path shows the dependencies for a successful user experience. The availability calculation is a simple sum of the product of failure frequency and recovery time of each component.

| Component | Failures per Year | Hours to Recover | Hours Failed per year |
| WAN Link | 0.5 | 8 | 4.0 |
| Router | 0.2 | 4 | 0.8 |
| Firewall | 0.2 | 4 | 0.8 |
| Switch | 0.1 | 12 | .12 |
| Web Server | 0.5 | 8 | 4.0 |
| Database Server | 0.5 | 8 | 4.0 |
| RAID Array | 0.1 | 12 | .12 |
| Power/Cooling | 1.0 | 2 | 2.0 |
| Total | 15.8 hours |
The estimate for this simple example works out to be about 16 hours of down time per year, not including any application issues, like performance problems, scalability issues.
- The estimate also doesn't consider the human factor.
- Because numbers we input into the chart are really rough, with plenty of room for error, the final estimate is also just a guesstimate.
- The estimate is the average hours of outage over a number of years, not the number of hours of outage for each year. You could have considerable variation from year to year.
Applying the Estimate to the Real World
To apply this to the real world and estimate an availability number for the entire application, you'd have to know more about the application, the organization, and the persons managing the systems.
For example - assume that the application is secure and well written, and that there are no scalability issues, and assume that the application has version control, test, dev and QA implementations and a rigorous change management process. That application might suffer few if any application related outages in a typical year. Figure one bad deployment per year that causes 2 hours of down time. On the other hand, assume that it is poorly designed, that there is no source code control or structured deployment methodology, no test/QA/dev environments, and no change control. I've seen applications like that have a couple hours a week of down time.
And - if you consider the human factor, that the humans in the loop (the keyboard-chair interface) will eventually mis-configure a device, reboot the wrong server, fail to complete a change within the change window, etc., then you need to pad this number to take the humans into consideration.
On to Part Two (or back to the Introduction?)
Estimating the Availability of Simple Systems - Redundant
This is a continuation of a series of posts that attempt to provide the basics of estimating the availability of various simple systems. The Introduction covered the fundamentals, Part One covered estimating the availability of non-redundant systems. This post will attempt to cover simple redundant systems.
Let's go back to the failure estimate chart from the introductory post, but this time modify it for redundant (active/passive) redundancy. Remember that for redundant components, the number of failures is the same (the MTBF doesn't change), but the time to recover (MTTR) is shortened dramatically. The MTTR is no longer the time it takes to determine the cause of the failure and replace the failed part, but rather the MTTR is the time that it takes to fail over to the redundant component.
| Component | Failures per Year | Hours to Recover (component) | Hours to failover (redundant) | Hours Failed per year |
| WAN Link | .5 | 8 | .05 | .025 |
| Routers, Devices | .2 | 4 | .05 | .01 |
| SAN Fabric | .2 | 4 | .01 | .002 |
| SAN LUN | .1 | 12 | .12 | .12 |
| Server | .5 | 8 | .05 | .025 |
| Power/Cooling | .2 | 2 | 0 | 0 |
Notice nice small numbers in the far right column. Redundant systems tend to do a nice job of reducing MTTR.
Note that if you believe in complexity and the human factor, you might argue that because they are more complex, redundant systems have more failures. I'm sure this is true, but I haven't considered that for this post (yet). Note also that I consider SAN LUN failure to be the same as for the non-redundant case. I've considered that LUN's are always configured with some for on redundancy, even in the non-redundant scenario.
 Now apply it to a typical redundant application stack. The stack mixed active/active, active passive. There are differences in failure rates of active/active and active/passive HA pairs, but for this post, the difference is minor enough to ignore. (Half the time, when a active/passive pair has a failure, the passive device is the one that failed, so service is unaffected. Active/active pairs therefor have a service affecting failure twice as often.)
Under normal operation, the green devices are active, and failure of any active device causes an application outage equal to the failover time of the high availability device pair.
The estimates for failure frequency and recovery time are:
| Component | Failures per Year | Hours to failover (MTTR) | Hours Failed per year |
| WAN Link | .5 | .05 | .025 |
| Router | .2 | .05 | .01 |
| Firewall | .2 | .05 | .01 |
| Load Balancers | .2 | .05 | .01 |
| Switch | .2 | .05 | .01 |
| Web Server | .5 | .05 | .025 |
| Switch | .2 | .05 | .01 |
| Database Server | .5 | .05 | .025 |
| SAN Fabric | .2 | .01 | .002 |
| SAN LUN | .1 | .12 | .12 |
| Power/Cooling | 1 | 0 | 0 |
| Total | .25 = 15 min |
These numbers imply some assumptions about some of the components. For example, in this trivial case, I'm assuming that :
- The WAN links must not be in the same conduit, or terminate on the same device at the upstream ISP. Otherwise they would not be considered redundant. Also, the WAN links likely will be active/active, so the probability of failure will double.
- Networks, Layer 3 verses Layer 2. I'll go out on a limb here. In spite of what vendors promise, under most conditions, layer 2 redundancy (i.e. spanning tree managed link redundancy) does not have higher availability than a similarly designed network with layer 3 redundancy (routing protocols). My experience is that the phrase 'friends don't let friends run spanning tree' is true, and that the advantages gained by the link redundancy provided by layer 2 designs are outweighed by the increased probability of spanning tree loop related network failure.
- Power failures are assumed to be covered by battery/generator. But many hosting facilities still have service affecting power/cooling failures. If I were presenting theses numbers to a client, I'd factor in power and cooling somehow, perhaps by guesstimating a hour or so per year, depending on the facility
These numbers look pretty good, but don't start jumping up and down yet.
Humans are in the loop, but not accounted for in this calculation. As I indicated in the human factor, the human can, in the case where redundant systems are properly designed and deployed, be the largest cause of down time (the keyboard-chair interface is non-redundant). Also, there is no consideration for the application itself (bugs, bad failed deployments) or consideration for the database (performance problems, bugs). As indicated in previous post, a poorly designed application that is down every week because of performance issues or bugs isn't going to magically have fewer failures because it is moved to redundant systems. It will just be a poorly designed, redundant application.
Coupled Dependencies
 A quick note on coupled dependencies. In the example above, the design is such that the load balancer, firewall and router are coupled. (In this design they are, in other designs they are not). A hypothetical failure of the active firewall would result in a firewall failover, a load balancer failover, and perhaps a router HSRP failover. The MTTR would be the time it takes for all three devices to figure out who is active.
 Coupled dependencies tend to cause unexpected outages themselves. Typically, when designing systems with coupled dependencies, thorough testing is needed to uncover unexpected interactions between the coupled devices. (In the case shown here interaction between HRSP, the routing protocol, the active/passive firewall, and layer 2 redundancy at the switch layer is complex enough to be worth a day in the lab.)
Conclusions
- Structured System Management has the greatest influence on availability.
- With non-redundant but well managed systems, the human factor will be significant, but should not be the major cause of outages.
- With redundant, well managed systems, the human factor may be the largest cause of outages.
- A poorly designed or written application will not be improved by redundancy.
Keep in mind that the combination of application, human and database outages, not considered in the calculation, will far outweigh simple hardware and operating system failures. For your estimations, you will have to add failures and recovery time for human failure, application failure and database failure. (Hint - figure a couple hours each per year.)
As indicated in the introductory post, I tried.
Back to the Introduction (or the previous post).
Failure Tolerance - the Google way
Another 'gotta think about this' article, this time via Stephen Shankland's news.com's summary of a Jeff Dean Google I/O presentation.
The first thing that piqued my interest is the raw failure rate of a new Google cluster. Jeff Dean is claiming that on new clusters, they have half as many failures as servers. (1800 servers, 1000 failures.) That seems high to me. Working with an order of magnitude fewer servers than a single Google cluster, we don't see anything like that kind of failure rate. Either there really is a difference in the reliability of cheap hardware, or I'm not comparing like numbers.
It's hard for me to imagine that failure rate working at a several orders of magnitude smaller scale. The incremental cost of 'normal' hardware over cheap hardware at the hundreds of servers scale isn't that large of a number. But Google has a cheap hardware, smart software mantra, so presumably the economics works out in their favor.
The second interesting bit is taking the Google-like server failure assumptions comparing them to network protocol failure assumptions. The TCP world assumes that losses will occur and the protocols need to gracefully and unobtrusively handle the loss. Wide area networks have always been like that. Wide area network engineers assume that there will be loss. The TCP protocol assumes that there will be loss. The protocols that route data and the end points of the session are smart. In network land, things work even with data loss and errors as high as 1%, and in HA network designs, we often assume that 50% of our hardware can fail and we'll still have a functional system.
In the case of routed wide area networks, it isn't necessarily cheap hardware that leads us to smart software (TCP, OSPF, BGP), it's unreliable circuits (the backhoe factor). In router and network land, smart software and redundancy compensates for unreliable WAN circuits. In theory smart software should let us run cheap hardware. In reality, we tend to have both smart software and expensive hardware. But a high hardware failure rate isn't really an option for network redundancy. If you've only got a single pair of HA routers 300 or 3000 miles away, and one dies, you've used up the +1 on your n+1 design. And it would be hard to build a remote routed node with more than a pair of redundant routers, mostly because the incoming telco circuit count would have to increase, and those things are expensive.
Compare that to SAN fabrics, file systems and relational databases, where a single missing bit is a catastrophe. There is simply no 'assumption of loss' in most application and database designs. The lack of loss tolerant designs in databases and file systems drives us to a model of both expensive hardware and expensive software.
There probably are a whole slew of places where we could take the engineering assumptions of one discipline apply them to an marginally related or unrelated discipline, with game-changing results.
(via Data Center Knowledge)
The first thing that piqued my interest is the raw failure rate of a new Google cluster. Jeff Dean is claiming that on new clusters, they have half as many failures as servers. (1800 servers, 1000 failures.) That seems high to me. Working with an order of magnitude fewer servers than a single Google cluster, we don't see anything like that kind of failure rate. Either there really is a difference in the reliability of cheap hardware, or I'm not comparing like numbers.
It's hard for me to imagine that failure rate working at a several orders of magnitude smaller scale. The incremental cost of 'normal' hardware over cheap hardware at the hundreds of servers scale isn't that large of a number. But Google has a cheap hardware, smart software mantra, so presumably the economics works out in their favor.
The second interesting bit is taking the Google-like server failure assumptions comparing them to network protocol failure assumptions. The TCP world assumes that losses will occur and the protocols need to gracefully and unobtrusively handle the loss. Wide area networks have always been like that. Wide area network engineers assume that there will be loss. The TCP protocol assumes that there will be loss. The protocols that route data and the end points of the session are smart. In network land, things work even with data loss and errors as high as 1%, and in HA network designs, we often assume that 50% of our hardware can fail and we'll still have a functional system.
In the case of routed wide area networks, it isn't necessarily cheap hardware that leads us to smart software (TCP, OSPF, BGP), it's unreliable circuits (the backhoe factor). In router and network land, smart software and redundancy compensates for unreliable WAN circuits. In theory smart software should let us run cheap hardware. In reality, we tend to have both smart software and expensive hardware. But a high hardware failure rate isn't really an option for network redundancy. If you've only got a single pair of HA routers 300 or 3000 miles away, and one dies, you've used up the +1 on your n+1 design. And it would be hard to build a remote routed node with more than a pair of redundant routers, mostly because the incoming telco circuit count would have to increase, and those things are expensive.
Compare that to SAN fabrics, file systems and relational databases, where a single missing bit is a catastrophe. There is simply no 'assumption of loss' in most application and database designs. The lack of loss tolerant designs in databases and file systems drives us to a model of both expensive hardware and expensive software.
There probably are a whole slew of places where we could take the engineering assumptions of one discipline apply them to an marginally related or unrelated discipline, with game-changing results.
(via Data Center Knowledge)
Simple Steps to Improving Availability - Five Essential Transitions
A poorly managed high availability cluster will have lower availability than a properly managed non-redundant system.
That's a bold statement, but I'm pretty sure it's true. The bottom line is that the path to improving system availability begins with the fundamentals of system management, not with redundant or HA systems. Only after you have executed the fundamentals will clustering or high availability make a positive contribution to system availability.
Here's the five transitions that are the critical steps on the path to improved availability:
Transition #1: From ad-hoc system management to structured system management.
Structured system management implies that you understand the fundamentals of building, securing, deploying, monitoring, logging, alerting, and documenting networks, servers and applications, that you have those fundamentals in place, you execute them consistently, and you know all cases where you are inconsistent. Ad hoc system management doesn't cut it.
Transition #2: From ad-hoc changes to simple change management.
Simple change management means that you have controls around changes sufficient to determine who/what/when/why on any change to any system or application critical file. Changes are predicted. Changes are documented. Changes are not random, and they do not 'just happen'. A text file 'changes.txt' edited with notepad.exe and stored in c:/changelog/ is not as comprehensive as a million dollar consultant-driven enterprise CMDB that takes years to implement, but is a huge step in the right direction, and certainly provides more incremental value at less cost than the big solution.
Transition #3: From 'i dunno....maybe.....' to root cause analysis.
Failures have a cause. All of them. The 'cosmic ray did it' excuse is bullshit. Find the root cause. Fix the core problem. You need to be able to determine that 'the event was caused by .... and can be resolved by ... and can be prevented from ever happening again by ...'. If you cannot find the cause and you have to resort to killing a process or rebooting a server to restore service, then you must add instrumentation, monitoring or debugging to your system sufficient so that the next time the event happens, you will find the cause.
Transition #4: From 'try it...I think it will work..' to 'my tests show that......'
Comprehensive pre-production testing ensures that the systems that you build and the changes that you make will work as expected. You know that they will work because you tested them, and in the rare case that they do not work as expected, you will be able do determine the variation between test and production devise a test that accommodates the differences.
Transition #5: From non-redundant systems to simple redundancy.
Finally, after you've made transitions one through four, you are ready for implementation of basic active/passive redundancy. Skipping ahead to transition #5 isn't going to get you to your availability goals any sooner.
Remember though, keep it simple. Complexity doesn't necessarily increase availability.
--Mike
That's a bold statement, but I'm pretty sure it's true. The bottom line is that the path to improving system availability begins with the fundamentals of system management, not with redundant or HA systems. Only after you have executed the fundamentals will clustering or high availability make a positive contribution to system availability.
Here's the five transitions that are the critical steps on the path to improved availability:
Transition #1: From ad-hoc system management to structured system management.
Structured system management implies that you understand the fundamentals of building, securing, deploying, monitoring, logging, alerting, and documenting networks, servers and applications, that you have those fundamentals in place, you execute them consistently, and you know all cases where you are inconsistent. Ad hoc system management doesn't cut it.
Transition #2: From ad-hoc changes to simple change management.
Simple change management means that you have controls around changes sufficient to determine who/what/when/why on any change to any system or application critical file. Changes are predicted. Changes are documented. Changes are not random, and they do not 'just happen'. A text file 'changes.txt' edited with notepad.exe and stored in c:/changelog/ is not as comprehensive as a million dollar consultant-driven enterprise CMDB that takes years to implement, but is a huge step in the right direction, and certainly provides more incremental value at less cost than the big solution.
Transition #3: From 'i dunno....maybe.....' to root cause analysis.
Failures have a cause. All of them. The 'cosmic ray did it' excuse is bullshit. Find the root cause. Fix the core problem. You need to be able to determine that 'the event was caused by .... and can be resolved by ... and can be prevented from ever happening again by ...'. If you cannot find the cause and you have to resort to killing a process or rebooting a server to restore service, then you must add instrumentation, monitoring or debugging to your system sufficient so that the next time the event happens, you will find the cause.
Transition #4: From 'try it...I think it will work..' to 'my tests show that......'
Comprehensive pre-production testing ensures that the systems that you build and the changes that you make will work as expected. You know that they will work because you tested them, and in the rare case that they do not work as expected, you will be able do determine the variation between test and production devise a test that accommodates the differences.
Transition #5: From non-redundant systems to simple redundancy.
Finally, after you've made transitions one through four, you are ready for implementation of basic active/passive redundancy. Skipping ahead to transition #5 isn't going to get you to your availability goals any sooner.
Remember though, keep it simple. Complexity doesn't necessarily increase availability.
--Mike
Availability - MTBF, MTTR and the Human Factor
We've got a couple of data centers. By most measures, they are small, at just over 100 servers between the two of them. We've been working for the last year to build the second data center with the specific design goal of being able to fail over mission critical applications to the secondary data center during extended outages. Since the goal of the second data center is specifically to improve application availability, I decided to rough in some calculations on what kind of design we'd need to meet our availability and recovery goals.
Start with MTBF (Mean Time Between Failure). In theory, each component that makes up the infrastructure that supports an application has an MTBF, typically measured in thousands of hours. The second factor in calculating availability is MTTR. (Mean Time to Recovery or Repair), measured in hours or minutes. Knowing the average time between failures, and the average time to repair or recover from the failure, one should be able to make and approximate prediction of the availability of a particular component.
Systems, no matter how complex, are made up of components. In theory, one can calculate the MTBF and MTTR of each component and derive the availability of an entire system. This can get to be a fairly involved calculation, and I'm sure somewhere there are people who make a living doing MTBF/MTTR calculations.
If this is at all interesting, read eventhelix.com's description of MTBF/MTTR and availability. Then follow along with my calculations, and amuse yourself at the conclusion. Remember, all the calculations are real rough. I was trying to get an order of magnitude estimate based on easily obtainable data, not an exact number.
Raw MTBF Data:
OK - the Single Person, non-redundant I just made up. But I figure that each employee probably will, if left alone with no constraints (change review, change management) will screw up once a year.
MTTR is simply an estimate of how long it takes to restore service in the event of a failure. For example, in the case of a failed non-redundant HDD that has a server OS and lots of data on it, that the MTTR would be the time it takes to call the vendor, have a spare delivered, rebuild the server and recover everything from tape backup. Figure 8 hours for a simple server. Or, in the case of a memory DIMM, I figure on hour to get through the tech support queue at the manufacturer, one hour to argue with them about your contract terms & conditions, 4 hours to deliver the DIMM, an hour to install and re-boot, or about 7 hours.
In the case of redundant or clustered devices, the MTTR is effectively the time it takes for the clustering or high availability software to figure out what has failed and take the failed device off line or route around it. Figure somewhere between 1 and 3 minutes.
To convert MTBF and MTTR to availability, some math is needed.
If systems have more than one component, and if all components are required for the system to operate, then the availability of the system is calculated by multiplying the availability of each component together to obtain the system availability. If the components are redundant, and if each of the redundant components is fully functional alone, then the availability of the system is (1 - (1-A)n). (Or - use an online calculator.)
Obviously in the case of redundant components, the system is only failed when both redundant components fail at the same time. That tends to be rare, so redundant systems can have much better availability.
How does this work out using some rough numbers?
First of all, an interesting problem immediately becomes evident. For maximum performance, I'd build a server with more CPU's, more memory DIMMS, more network cards, and more disk controllers. The component count goes up. If I build the server without redundancy, the server is less reliable. But faster. Most server vendors compensate for this by building some components with error correction capability, so that even thought component fails, the system still runs. But more components, in theory, will result in a less reliable server. So in rough numbers, using only memory DIMMs in the calculation, and assuming no error correction or redundancy:
Adding non-redundant components doesn't help availability. A high end server with lots of DIMM's, is already at four 9's, without even considering all the other components in the system.
In clustered, or high availability systems, the availability calculation changes dramatically. In the simple case of active/passive failover, like Cisco firewalls or Microsoft clustering, the MTBF doesn't change, but the MTTR does. The MTTR is essentially the cluster failover time, usually a minute or so. Now the time that it takes the tech to show up with parts is no longer relevant.
Take the same numbers above, but make the MTTR 3 minutes (cluster failover time) and the theoretical availability goes way up.
Start with MTBF (Mean Time Between Failure). In theory, each component that makes up the infrastructure that supports an application has an MTBF, typically measured in thousands of hours. The second factor in calculating availability is MTTR. (Mean Time to Recovery or Repair), measured in hours or minutes. Knowing the average time between failures, and the average time to repair or recover from the failure, one should be able to make and approximate prediction of the availability of a particular component.
Systems, no matter how complex, are made up of components. In theory, one can calculate the MTBF and MTTR of each component and derive the availability of an entire system. This can get to be a fairly involved calculation, and I'm sure somewhere there are people who make a living doing MTBF/MTTR calculations.
If this is at all interesting, read eventhelix.com's description of MTBF/MTTR and availability. Then follow along with my calculations, and amuse yourself at the conclusion. Remember, all the calculations are real rough. I was trying to get an order of magnitude estimate based on easily obtainable data, not an exact number.
Raw MTBF Data:
| Single Hard Drive, high end manufacturer: | 1.4 million hours |
| Single DIMM, moderately priced manufacturer: | 4 million hours |
| Single CPU: | 1 million hours |
| Single network device (switch): | 200,000 hours |
| Single person, non-redundant: | 2000 hours |
OK - the Single Person, non-redundant I just made up. But I figure that each employee probably will, if left alone with no constraints (change review, change management) will screw up once a year.
MTTR is simply an estimate of how long it takes to restore service in the event of a failure. For example, in the case of a failed non-redundant HDD that has a server OS and lots of data on it, that the MTTR would be the time it takes to call the vendor, have a spare delivered, rebuild the server and recover everything from tape backup. Figure 8 hours for a simple server. Or, in the case of a memory DIMM, I figure on hour to get through the tech support queue at the manufacturer, one hour to argue with them about your contract terms & conditions, 4 hours to deliver the DIMM, an hour to install and re-boot, or about 7 hours.
In the case of redundant or clustered devices, the MTTR is effectively the time it takes for the clustering or high availability software to figure out what has failed and take the failed device off line or route around it. Figure somewhere between 1 and 3 minutes.
To convert MTBF and MTTR to availability, some math is needed.
If systems have more than one component, and if all components are required for the system to operate, then the availability of the system is calculated by multiplying the availability of each component together to obtain the system availability. If the components are redundant, and if each of the redundant components is fully functional alone, then the availability of the system is (1 - (1-A)n). (Or - use an online calculator.)
Obviously in the case of redundant components, the system is only failed when both redundant components fail at the same time. That tends to be rare, so redundant systems can have much better availability.
How does this work out using some rough numbers?
First of all, an interesting problem immediately becomes evident. For maximum performance, I'd build a server with more CPU's, more memory DIMMS, more network cards, and more disk controllers. The component count goes up. If I build the server without redundancy, the server is less reliable. But faster. Most server vendors compensate for this by building some components with error correction capability, so that even thought component fails, the system still runs. But more components, in theory, will result in a less reliable server. So in rough numbers, using only memory DIMMs in the calculation, and assuming no error correction or redundancy:
| DIMM Count | MTBF (Hours) | MTTR (Hours) | Availability |
|---|---|---|---|
| 1 | 4 million | 8 hours | 99.9998% |
| 4 | 4 million | 8 hours | 99.9992% |
| 8 | 4 million | 8 hours | 99.9984% |
| 16 | 4 million | 8 hours | 99.9968% |
| 32 | 4 million | 8 hours | 99.9936% |
| 64 | 4 million | 8 hours | 99.9972% |
Adding non-redundant components doesn't help availability. A high end server with lots of DIMM's, is already at four 9's, without even considering all the other components in the system.
In clustered, or high availability systems, the availability calculation changes dramatically. In the simple case of active/passive failover, like Cisco firewalls or Microsoft clustering, the MTBF doesn't change, but the MTTR does. The MTTR is essentially the cluster failover time, usually a minute or so. Now the time that it takes the tech to show up with parts is no longer relevant.
Take the same numbers above, but make the MTTR 3 minutes (cluster failover time) and the theoretical availability goes way up.
| DIMM Count | MTBF (Hours) | MTTR (Hours) | Availability |
|---|---|---|---|
| 1 | 4 million | .05 hours | 99.9999% |
| 4 | 4 million | .05 hours | 99.9999% |
| 8 | 4 million | .05 hours | 99.9999% |
| 16 | 4 million | .05 hours | 99.9999% |
| 32 | 4 million | .05 hours | 99.9999% |
| 64 | 4 million | .05 hours | 99.9999% |
Active/passive clustering doesn't change MTBF, but is does change MTTR, and therefore availability. I ran through a handful of calculations, and figure out that if all we have is a reasonable level of active/passive redundancy on devices and servers, and a reasonably well designed network and storage, we should be able to meet our availability goals.
Except......
The Human Factor:
So I was well on my way down this path, trying to determine if Layer-3 WAN redundancy was adequate to meet availability goals, and if active/passive clusters combined with dual switch fabrics and HA load balancers and firewalls will result in MTBF and MTTR's that make sense, when I decided to figure in the human factor.
I figure that the more complex the system, the higher the probability of a human induced failure, and that humans have a failure rate that is based not only on skill and experience, and also on the structure of the processes that are used to manage the systems.
Assume, as above, that a person makes one error per year, and that the error results in 30 minutes of downtime. That already drops you down to 99.99% availability. That's without considering any hardware, software, power or other outages. If you figure that you have a handful of persons that are in a position to make an error that results in downtime, you've got a problem.
Fortunately, persons can be made redundant, and processes (Change Management) can be designed to enforce person-level redundancy.
So now I'm thinking about Change Management, QA environments, test labs.
Related Posts:
Estimating Availability of Simple Systems – Introduction
Estimating Availability of Simple Systems - Non-redundant
Estimating Availability of Simple Systems - Redundant
Availability, Complexity and the Person-Factor
Availability, Longer MTBF and shorter MTTR
(2008-07-19 -Updated links, minor edits)
Subscribe to:
Posts (Atom)
-
Cargo Cult: …imitate the superficial exterior of a process or system without having any understanding of the underlying substance --Wikipe...
-
Structured system management is a concept that covers the fundamentals of building, securing, deploying, monitoring, logging, alerting, and...
-
In The Cloud - Outsourcing Moved up the Stack [1] I compared the outsourcing that we do routinely (wide area networks) with the outsourcing ...
